
In this edition of Digital Asset Friday, we will showcase how we utilize the new field of on-chain metrics to help answer two of the most asked questions we have been receiving over the last week:
- Have we hit the bottom of the crypto markets?
- Is this a time to be buying?
On-Chain Metrics Defined and Their Importance
Also known as Blockchain Analytics, these metrics explore indicators that use on-chain datasets to unveil fundamental analyses for digital assets. On-chain analytics can be broken down into financial, network, ownership, and exchange-flows indicators. Digital Assets are the first asset class where investor activity can be extracted from massive data sets through each digital asset’s public ledger, which captures every on-chain action in history, in real-time. This is revolutionary and, in the future, will give asset managers and investors more intelligence on investor behaviors than ever thought of before.
I say in the future because the challenge is there are no universally accepted standards on which to gather and synthesize this data. This is rapidly changing and maturing the longer time goes on, however. Currently, analysts and investors are in the process of standardizing the capture of this enormous amount of data. Over the next 3-5 years the hard part of synthesizing the data to create universally accepted standards and actionable intelligence will occur.
We believe the on-chain analysis is fundamental to investing in digital assets. This is another reason advisors come to us as we are at the forefront working with other asset managers and institutions to create the standards for the analysis of digital assets.
We use on-chain analysis to help us create guidelines in the following:
- Guidelines to how much and when to buy new cash:
- Segmenting buy-zones for that we deem as High Risk, Medium Risk, and Low Risk
- Ex. In November 2021 when Bitcoin hit a new all-time high at $69,000 we had the following buy zones:
- High Risk Zone: $58,000 0 $69,000
- Medium Risk Zone: $49,000 – $57,999
- Low Risk Zone: $40,000 – $48,999
- Guidelines to sell discipline and rebalance strategy
- Historically our sell discipline has been at extreme lows due to how the asset class has rewarded HODLers exponentially more than those who have tried timing market bottoms and tops.
- With the maturation of digital asset markets and refining of our process we are open to evolving in this area and utilizing on-chain metrics to inform us when there are opportunities to take profits at time where there is minimal risk to missing out on potential exponential moves.
- Identifying Tops and Bottoms
- Digital Asset Participant Behaviors
- Investors
- Developers/Builders
- Miners
- Ex. In November 2021 when Bitcoin hit a new all-time high at $69,000 we had the following buy zones:
- Segmenting buy-zones for that we deem as High Risk, Medium Risk, and Low Risk
No one can predict what is going to happen in the short term. 99.9% of forecasters and predictors in the digital asset markets have been wrong. We are human and fallible. Therefore, we don’t make price predictions. We are long-term investors and will use data to help inform our decisions that align with the goals of our portfolios. Whenever we are asked the age-old question, “What do you think the price is going to be?” we will have the same answer every time. We start with if our investment thesis is or is close to breaking, then for the short term will give you a High Probability, Low Probability, and an in-between probability for what could happen, and finally finish with “We don’t know for certain.”
Given its nascency, the sheer amount of data, and absence of academic research for establishing universal standards we utilize many data providers:
Examples of On-Chain Metrics
*Charts and analysis gathered from CryptoQuant
Given the sheer number of on-chain metrics that exist and are being developed, we will home in on two on-chain metrics but then list out some of our favorites for you to dive into.
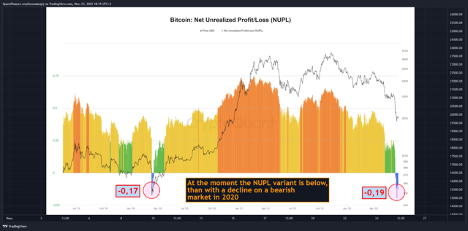
Bitcoin: NUPL – Net Unrealized Profit/Loss
Net Unrealized Profit and Loss (NUPL) is the difference between market cap and realized cap divided by market cap. It shows the changing profit geography of investors.
Historically, it has been spotted that the Bitcoin market with a NUPL of 0.7 or higher turned out to be closer to the market top. For investors, it would be wise to take a cautionary approach to the market when NUPL points above 0.7.
Also, a market with a NUPL of -0.2 or less turned out to be closer to the market bottom. For investors, it could be a buying opportunity and accumulate bitcoin.
If we compare the NUPL (Net Unrealized Profit/Loss) indicator, we will see a very interesting picture. At the time of the capitulation, at the bottom of the bear market in 2020, the NUPL was -0.17, but now it is even lower. Now, on the decline to $17.605, the NUPL was -0.19. That is, the unrealized loss rate has already surpassed the bottom of 2020.
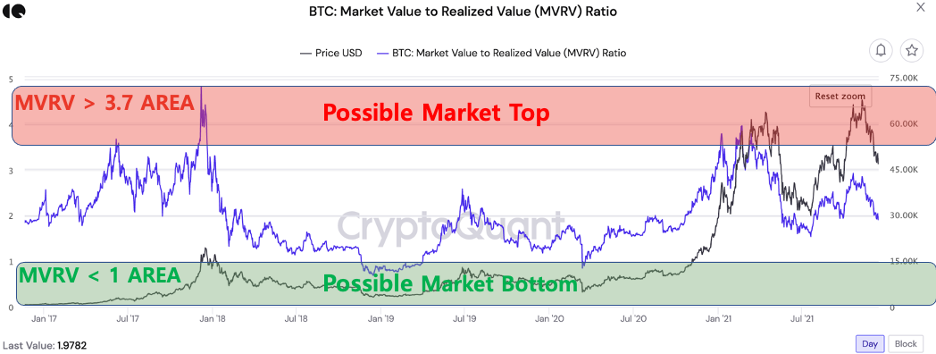
Bitcoin: MVRV Ratio
MVRV (Market Value to Realized Value) ratio is defined as an asset’s market capitalization divided by realized capitalization. Historically, values over 3.7 are a possible market top and could be reasonable to sell or take profits. Values under 1 are a possible market bottom and could be a time for taking a long position.
Let’s look at the times where MVRV was below 1:
- September 2011-March 2012: MVRV low was 0.39 and BTC price was at $2.32 roughly 90% off the all-time high of $24
- BTC price next time MVRV went below 1: $399.21
- October 2014-October 2015: MVRV low was 0.67 and BTC price was $208 roughly 80% off the all-time high of $1,000
- November 2018-March 2019: MVRV low was 0.73 and BTC price was $3,215 roughly 75% off the all-time high of $13,160
- March 2020: MVRV low was 0.92 and BTC price was $5,400 roughly 70% off the all-time high of $19,000
- Now – June 2022: MVRV’s current low was 0.83 on June 20th and BTC price was $18,945 and was 72.5% off all-time high
We use these and other on-chain indicators to help us create the guidelines for how we manage our portfolios. The markets are evolving quickly and what is used today may not be used tomorrow, R.I.P. Stock-to-Flow ratio. Bitcoin and Ethereum have the most robust data as they are the longest living and most Lindy. Given their market dominance, we feel we can safely use many on-chain metrics as a proxy for digital asset markets. This will change as the markets mature and other networks gain network effects and become more Lindy.
Another important note is that on-chain metrics are limited to activity happening on open-source blockchains and do not include activity happening on centralized exchanges. This is another reason why talent that comes into the space ends up staying and saying things like “This is so much better.” And “Why in the world don’t we use this in the traditional world?”.
The learning here is that you need dedicated resources to follow these markets otherwise you are simply just guessing. Due to the high degree of unknowable risk in digital asset markets, there is a small element of this regardless of how sophisticated you are and how much data you have access to. We believe however that the odds, in the long run, will be in our favor, and thus your client’s favor.
Other On-Chain Metrics:
- Realized Cap UTXO Age Bands
- SOPR Ratio (LTH-SOPR/STH-SOPR)
- Miners’ Position Index, MPI
- Thermo Cap & Delta Cap
- NVT Ratio
- Puell Multiple
- Transfer Volumes
- Active Addresses
- Transactions (doesn’t include centralized exchanges)
Answering the Questions:
-
Have we hit the bottom of the crypto markets?
As mentioned last week, digital asset markets are in uncharted territory and have never gone through the macro environment we currently sit in and are looking towards over the next 12 months. Combining this with on-chain analysis and traditional technical analysis we think there is a higher probability we test the downside zones of BTC at 14-18k, and if we get worsening macro data will test the $10-14k zone.
For the lower probability outcome of a sustained upside move, we would need to see a catalyst from strengthening macro data or positive policy movement.
The long-term investment thesis still stands and we look forward to the toxic areas of digital assets continuing to be flushed out of the system.
-
Is this a time to be buying?
Based on the data this is the time to be considering an allocation to digital assets. Now is the time to engage with us to plan and see if it makes sense for an allocation. We are here to support in phone calls, education materials, and developing allocation plans.
Crypto Learning
Webinar: Removing Friction from the Crypto Ecosystem, 12:00 pm ET, June 29th, 2022
Presented by Coindesk: There is a lot of friction in the crypto ecosystem. And whether it’s fiat on/off ramps, payments, security, or connectivity, these issues are not easy to manage or scale solutions for. Join BCB Group and Fireblocks to hear how institutions should be thinking about removing the friction from the crypto ecosystem and making their crypto strategies, products, and services more usable and scalable.
Reading: The Durability Formula – How It Will Determine Your Startup’s Future Value
We compare investing in decentralized, open, permissionless networks to early-stage tech investing. We find this read pertinent to the times we are currently in when Durability is more important than ever. We have utilized the learnings from this to help inform our fundamental research of a network and its ability to achieve strong Lindy effects.