Arbor Digital Quarterly Report
Note: Please see Arbor Digital’s Glossary Page or Gemini’s Cryptopedia for definitions on any crypto jargon you come across. We understand the learning curve of a new language and hope to help guide you in this area.
Disclosure: Past performance is not indicative of future returns. Investing in digital assets involves risk, including total loss of invested capital. Returns are calculated net of management fees. Performance information has been compiled by Arbor Digital, has not been independently verified, and does not reflect the impact of taxes on non-qualified accounts. In preparing this report, Arbor Digital has relied upon information provided by the account custodian.
Q2 was one of the most difficult quarters in digital asset history. Thankfully Q3 followed with one of the most hopeful and historic quarters in digital asset history. You wouldn’t think it if you only looked at the price and macroeconomic data. So why do we have this stance?
First, we realized the long-anticipated Ethereum merge on Thursday, September 15th, which transitioned Ethereum’s consensus mechanism from Proof of Work to Proof of Stake. Merge Day will forever be a significant milestone in the industry. We also got a barrage of announcements from traditional financial institutions like Blackrock, Visa, BNY Mellon, and Franklin Templeton all establishing Digital Asset infrastructure. SWIFT, yes that SWIFT which serves as the interbank messaging system that allows for cross-border payments, is working with Chainlink, a provider of price feeds and other data to blockchains, on a cross-chain interoperability protocol (CCIP) in an initial proof-of-concept. Key word being interoperable. Tokenized assets anyone? CBDCs, stablecoins, and BTC flowing through a blockchain? This may not be the world everyone in the crypto world envisioned but this is what is shaping up and we are here for it.
Another reason why we are positive is the fact in Q3 we started to see meaningful movement on the global regulatory front. Our view is that the next catalyst for growth in digital assets is regulatory clarity across the world. The first regulatory reports from the US Department of Justice and the Department of the Treasury were released and points to a responsible road to innovation. After two years of debate, the European Union finalized the full text of its landmark Markets in Crypto Assets (MiCA) legislation which now goes to parliament for approval. It is expected to be approved and published in the Official Journal of the European Union early next year, with the rules set to come into force in 2024. For a light weekend read here is the 380-page proposal.
From a price standpoint, Digital asset markets experienced a bear market rally to kick Q3 off all the way into mid-August where Bitcoin rallied all the way up to $25,000 from a low of $19,500, and ETH posted an even greater rally reaching $2,000 from a low of $1,000. But alas it was quickly quelled by the end of the quarter with BTC basically trading flat and ETH up 30%. Further analysis of Bitcoin and Ethereum on-chain metrics like MVRV, SOPR, NVT ratio show we are still in historical low zones.
In Q3 Bitcoin and Ethereum network adoption on mainnet and growth continued its downtrend from the peaks late last year with daily active addresses, transactions, and volume all hitting pre-pandemic levels. But Layer 2’s and scaling solutions are showcasing good growth that needs to be accounted for when evaluating the space. Revenues across Decentralized Finance and Web3 infrastructure continue to fall, especially when denominated in US dollars.
Despite the lack of fundamentals on mainnet in the short term, we remain as convicted as ever on the industry due to the resiliency the industry has shown, the amount of digital asset infrastructure being built (see below), and the use case evolution. Given the uncertainty of the macro backdrop, we expect it will take time to realize all this from a price standpoint, probably longer than many anticipate. This is an opportunity for investors to dollar cost average in and takes advantage of tax loss harvesting strategies. The chess pieces are slowly getting to their positions on the board with firms establishing themselves for when regulatory clarity comes, and the macro environment improves.
When we look back at Q3 2022 though, what will stand out is:
- The completion of the Ethereum merge
- The continued Merge of TradFi, DeFi, and CeFi
If any of those words in the second point are foreign to you then go check out my article on our blog where I review it.

See below for a list of high-impact announcements:
- SWIFT partners with Chainlink for Proof of Concept Protocol
- Coinbase Partners with BlackRock to provide Aladdin access to Digital Asset Trading and Custody
- BNY Mellon Launches New Digital Asset Custody Platform
- NASDAQ to Build and Offer Crypto Custody and Services
- EY builds Ethereum-based “Ops-Chain ESG”
- French Bank BNP Paribas Enters Crypto Custody
- Citibank and Morgan Stanley Double Down on Hiring Efforts for Digital Assets
- CME Group to offer ETH Options Trading
- South Africa’s Central Bank Greenlights Financial Institutions to Serve Crypto Clients
- Fidelity Adds to Crypto Offerings With Ethereum Index Fund
- Schwab, Fidelity, and Citadel back digital asset exchange EDX Markets
- Google Partners With Coinbase to Accept Crypto Payments and access Digital Asset Custody
- MakerDAO invests Balance Sheet in US Treasuries and Corporate Bonds
- Visa and FTX Partner for Debit Card Offer in 40 Countries
- Franklin Templeton launches Digital Asset SMA Models
- ARK Invest and Eaglebrook
- GeminiBITRIA and Envestnet
- BitGo Wealth Management Platform
A Deeper Dive into Network Adoption
In our weekly updates, we focus on price, market cap, and on-chain metrics to give a sense of what is going on in the markets. You can read our latest Digital Asset Friday here.
But what is also important to long-term investors, and to our investment thesis, is user adoption rates. Rather than focusing on price and short-term technical indicators, we are going to keep this simple and answer the following fundamental question:
- Are digital asset networks establishing network effects?
- Are people using the networks?
If we are following Metcalfe’s Law, which states the value of a network will be determined by the number of users in the system, then we would expect the price of networks to go up as more active users come into the ecosystem.
Take Bitcoin, for example, it’s built and designed for one type of transaction, moving value from one wallet to another without an intermediary. Ethereum on the other hand has been built to handle multiple types of transactions, including the above, the other types of transactions are:
- Smart Contract deployment transactions: a transaction without a ‘to’ address, where the data field is used for the contract code.
- Execution of a contract: a transaction that interacts with a deployed smart contract. In this case, the ‘to’ address is the smart contract address.
Both networks continue to evolve in the bear market of 2022 and Q3 was no different. But is that translating to more active addresses and transactions? Are these networks expanding into traditional networks? Let’s look at active addresses, transaction counts, and volume on the two largest networks, Bitcoin and Ethereum. For Ethereum, we will also look at the total number of contracts to account for this type of transaction. We will then look at DeFi and Polygon, a Layer 2 solution on Ethereum.
Bitcoin
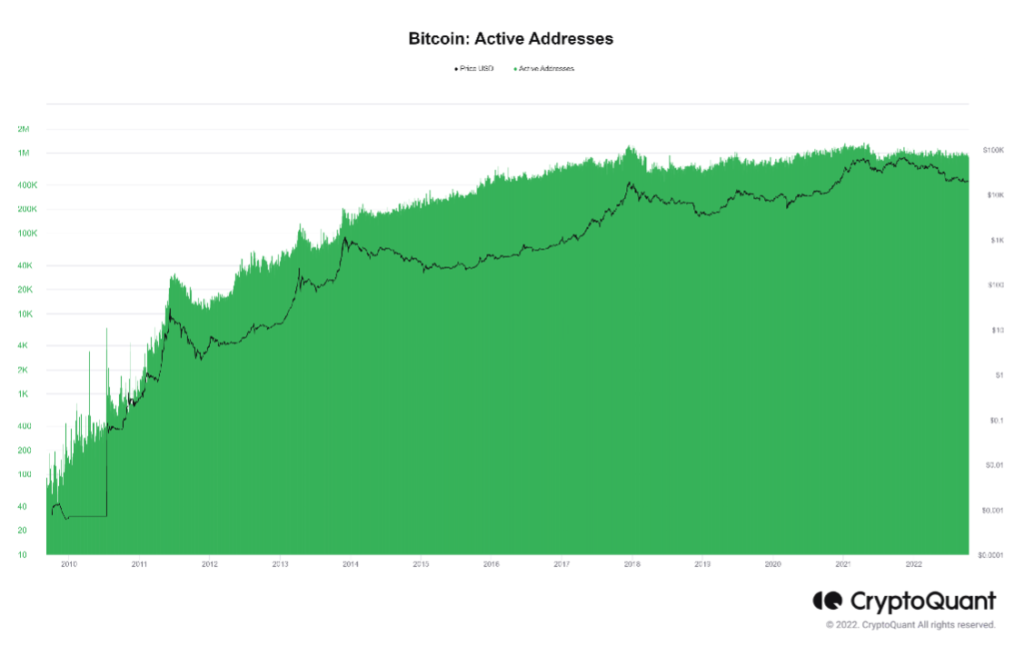
*Source: CryptoQuant.com
Starting with a daily active address, which is defined as a unique wallet address, inclusive of senders and receivers, that has made a single transaction on a particular network. For Bitcoin, active addresses have reverted to levels not seen since 2019. As you can see above, active addresses peaked in April 2021 at 1.25 million and currently sits at 835,000 as of the end of Q3.
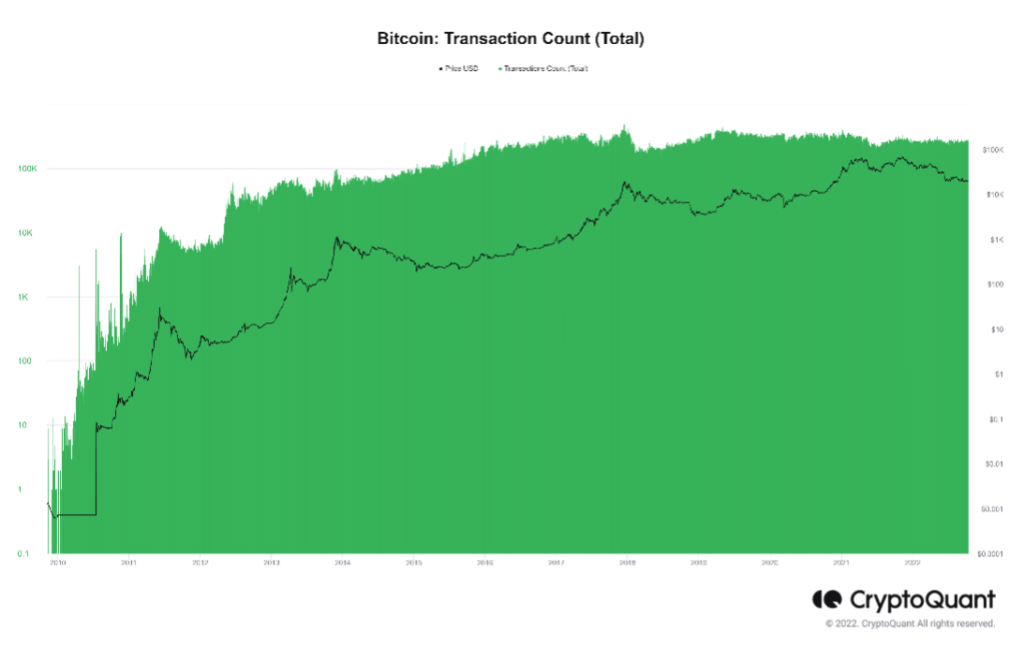
*Source: CryptoQuant.com
Now let’s look at transaction counts of BTC on the Bitcoin network from inception until the end of Q3 2022. As you can see above, in the first 8 years of launching mean transactions per block steadily rose as more users came into the network peaking at nearly 500,000 daily transactions in the bull market of 2017 coinciding with hitting its all-time high price at the time of $19,000 per BTC. Although a precipitous fall in price, transaction counts took less of a dive in 2018 to range between 144,000 and 200,000. In mid-2019 transactions picked back up staying within a range of 250,000 to 360,000 and then with the China ban on BTC mining transactions fell to the lower levels of 120,000 for short period but recovered quickly to the upper ranges. This is where transaction levels have been since then and in Q3 ranged from 240,000 and 290,000.
Ethereum
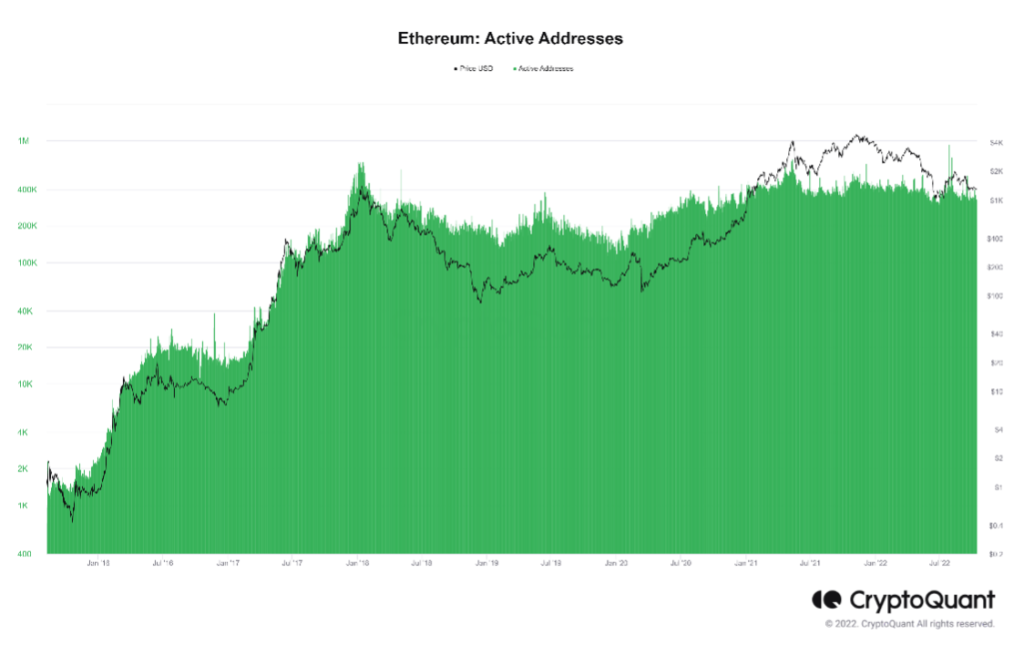
*Source: CryptoQuant.com
Let’s look at Ethereum now. After the initial launch and the ICO craze that fueled the bull market into 2018, we saw active addresses skyrocket, before hitting their low in January 2020. From then on steady growth upwards. As of the end of Q3, we are now at similar levels to pre-pandemic.
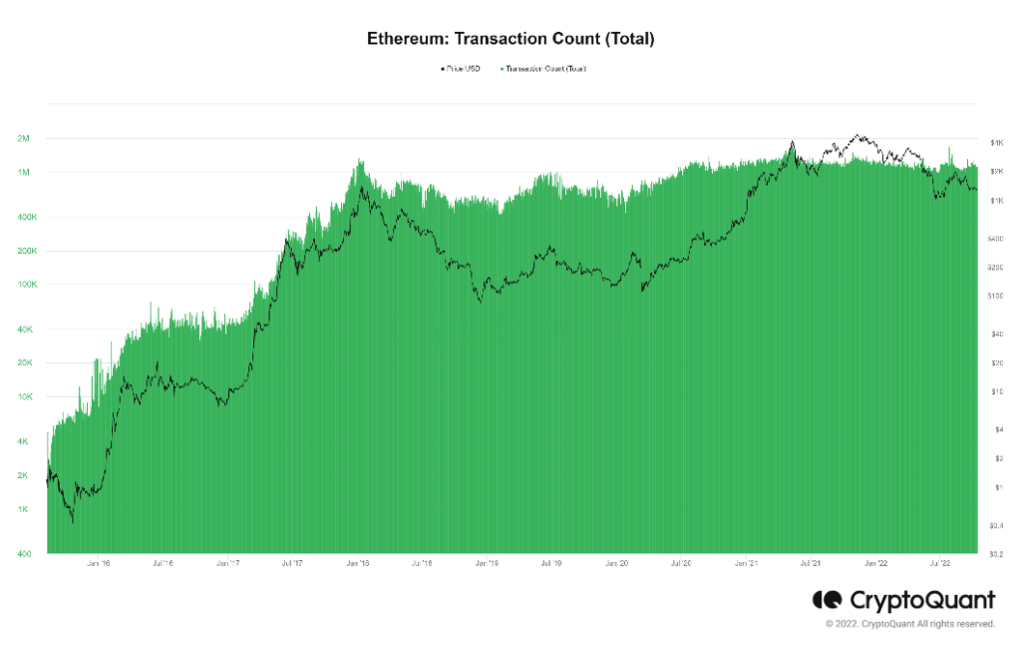
*Source: CryptoQuant.com
Ethereum’s transaction count follows a similar trajectory. The main difference lies in the rise of NFTs in the first half of 2021. Volumes spiked but have since normalized back to pre-pandemic levels.
*Source: CryptoQuant.com
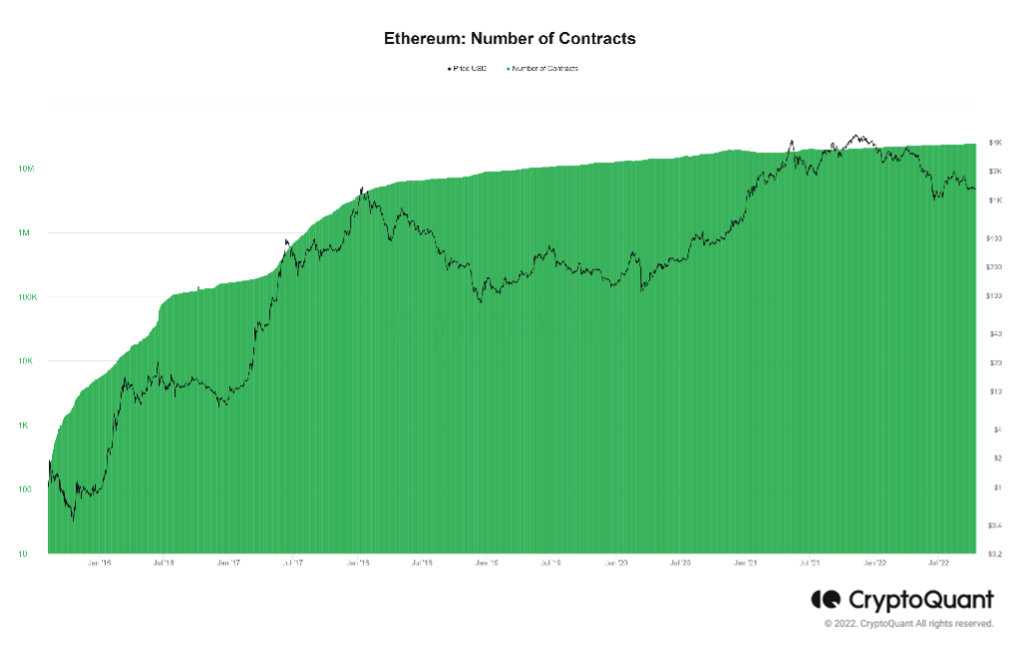
The number of contracts is defined as the number of unique smart contracts in existence on the Ethereum network. Which hasn’t stopped growing since Ethereum’s mainnet launch. The number of contracts has consistently grown throughout different cycles and as of the end of Q3, there are 24 million unique contracts in existence.
Decentralized Finance (DeFi)
*Source: DefiLlama.com
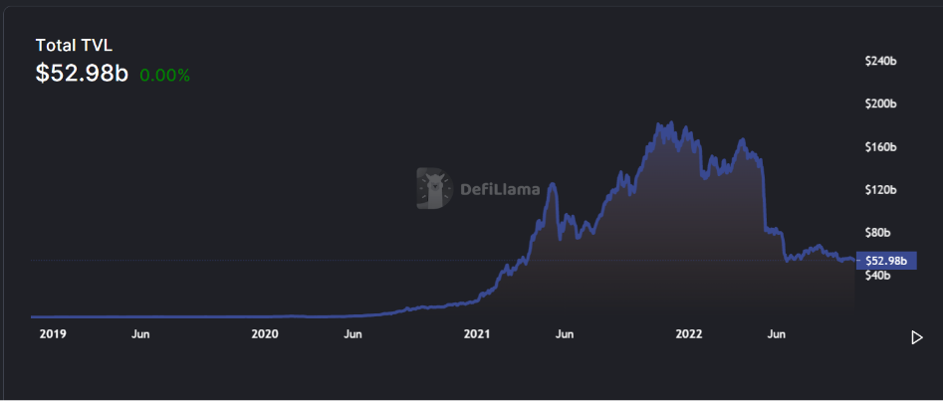
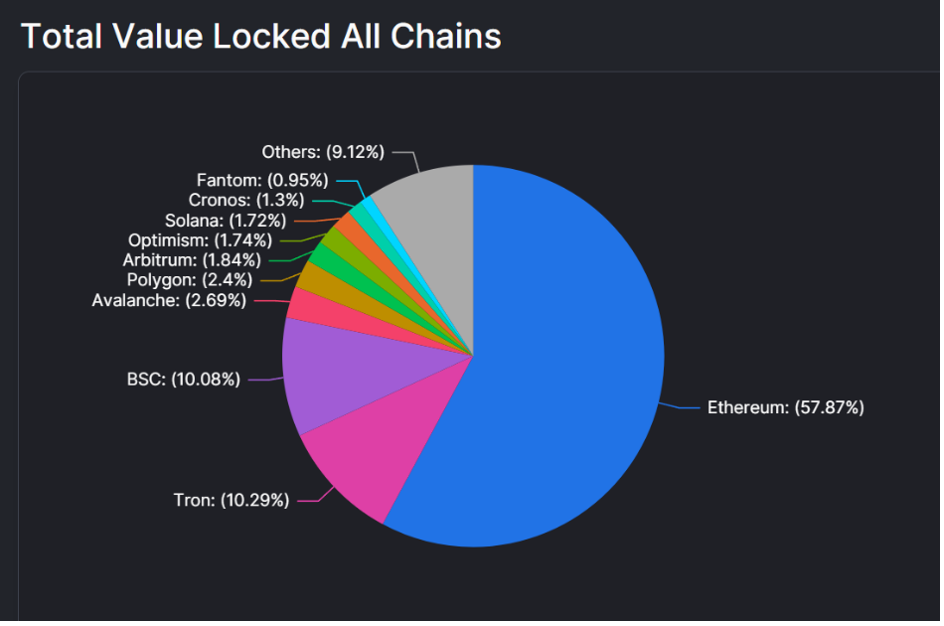
A common metric to use to capture the growth of the Decentralized Finance sector is Total Value Locked (TVL). TVL is defined as the total value of digital asset locked in a smart contract on that protocol. More TVL means more capital within a network that can be used to provide liquidity and usability. It’s also important to note that DeFi is multi-chain, but currently, Ethereum dominates.
TVL has followed a similar trend as network metrics we have gone over on Bitcoin and Ethereum. As of September 30th, DeFi TVL sits at ~53 billion which is where it was in March of 2021.
*Source: Messari Research
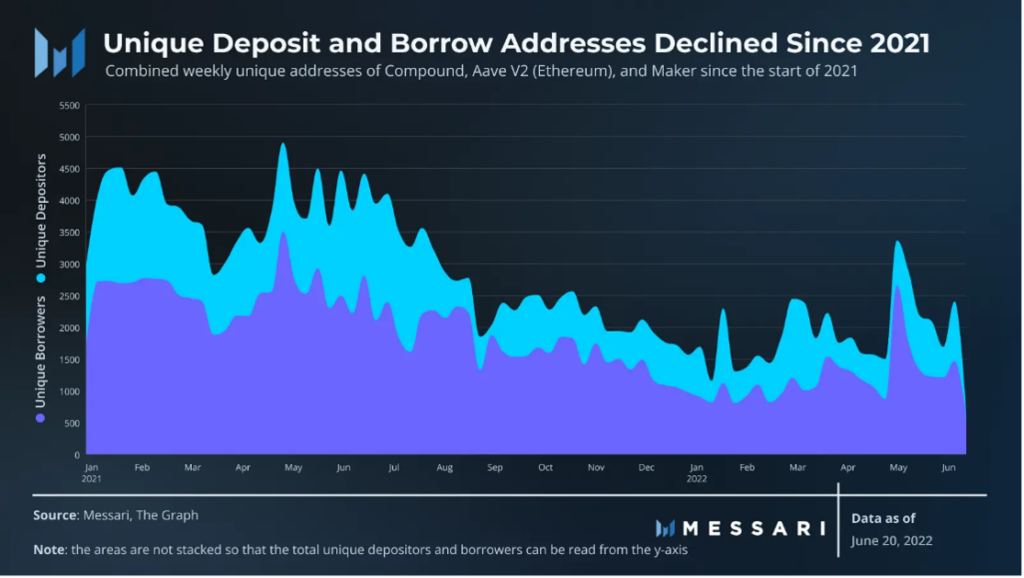
Research partner Messari did some great work regarding the borrowing and lending markets within DeFi finding that Compound, Maker, and Aave (specifically V2 on Ethereum) are the top lending protocols. Together, they have seen the weekly unique addresses depositing and borrowing decline since coming out of DeFi summer in 2021. As the price of ETH nearly doubled in early May 2021, the unique weekly depositor and borrower count topped out at about 5,000 and 3,500 addresses, respectively. Now, in 2022, the unique weekly users are down over 60% from the May 2021 peak.
Aave and Maker saw increases in the larger, more profitable customer segments. Aave saw a 10% increase in the borrower amount from larger addresses with over $10 million borrowers. Maker experienced the most growth in this segment with 86% growth from H1 2021 to H2 2022. Additionally, Maker was the only major lending protocol to experience growth in the $1 million to $10 million customer segment. In the smaller customer segments, however, both Aave and Maker saw similar regression to the overall sector. Compound significantly underperformed the other protocols in the sector — especially in the key customer segments.
Now, this is the point where most people who analyze the space feel comfortable and so they stop. However, stopping here misses out on so much more that is happening in the space in terms of growth and adoption. Don’t worry though this is where we come in.
Polygon and the Growth of L2’s
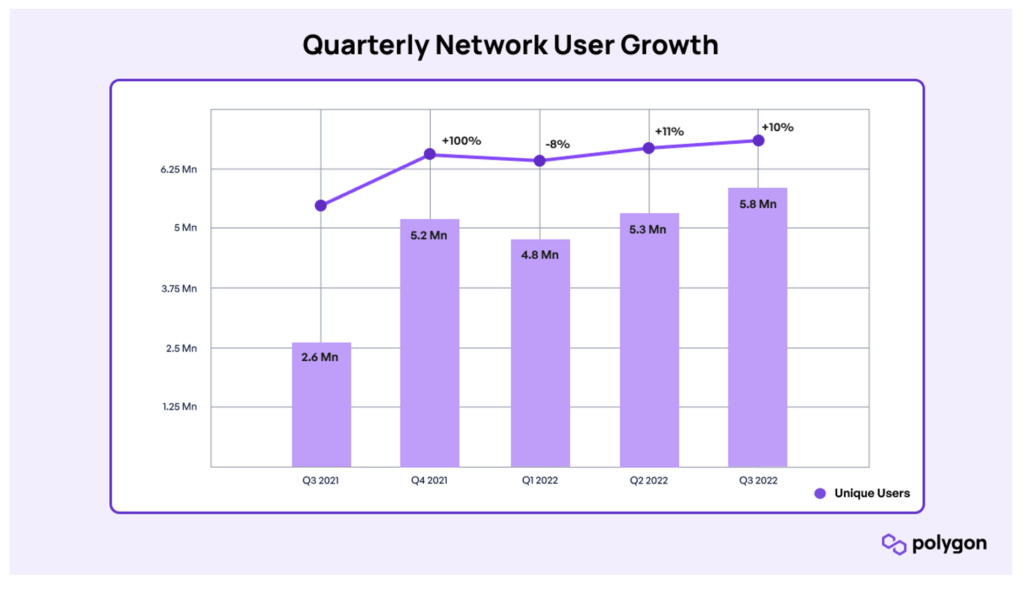
Polygon has witnessed significant growth from a user perspective in 2022. Active addresses reached a new all-time high of 5.8 million in Q3, which is an 11% increase from the previous quarter. Most of the user makeup comes from Benji Bananas with 423,000, 1Inch at 159,000 (+67% quarter over quarter), Uniswap V3 at 101,000 (+16% quarter over quarter), and Ultimate Champions at 66,000. Weekly active users have grown for four consecutive weeks to round out Q3, reaching a total of 1.56 million.
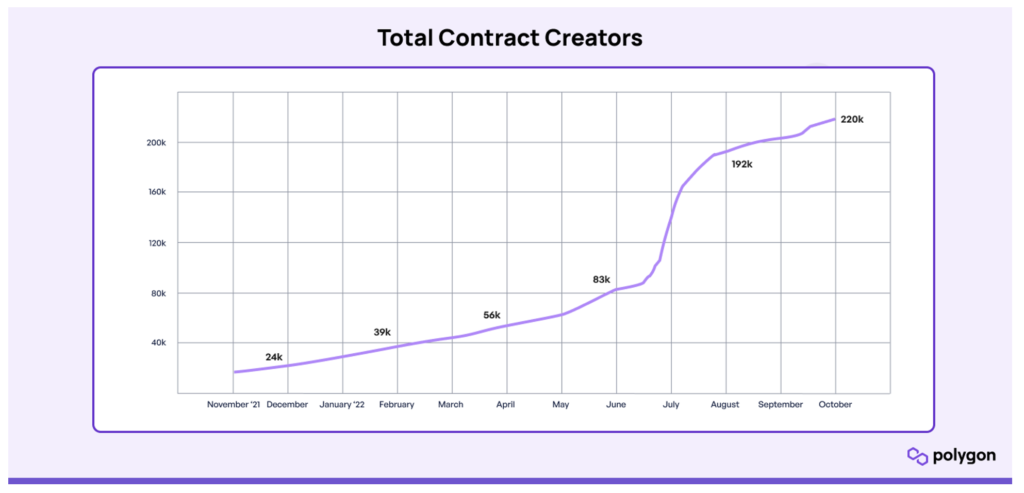
The number of deployed contracts on Polygon has doubled in the last five months to reach a total of 940,000 as of the end of Q3. The creator count has also seen a massive spike since May to roughly 220,000 unique contract creators.
Vitalik Buterin, one of the creators of the Ethereum network, has been quoted on how integral Layer 2s are to the success of Ethereum mainnet.


Putting it all together…
So, are networks establishing network effects, and are people using them? After reading all the above you may be telling yourself, “Well this doesn’t look like we are going to the moon.” You would be correct in the short term if you are only looking at mainnet. It’s full-on crypto winter there and we have our parkas on and generators ready. We are from Alaska; we live in the cold and welcome it.
It’s true that network adoption and growth have stagnated on the mainnets, except for smart contracts on Ethereum, and we are back to levels just before the pandemic, i.e. pre-extreme quantitative easing. But Layer 2’s and scaling solutions are showcasing good growth that needs to be accounted for when evaluating the space. Therefore, it is important not to narrow your vision to just Bitcoin and Ethereum. Everyone is learning just like with other risk assets, specifically tech, Digital assets aren’t immune to cycles connected to the real world, as much as others want to say they aren’t, and we are seeing this play out. This is the healthy washout of false growth exasperated by generous monetary policy that lifted all assets, not just digital. We see the washout of smaller users being all the speculators who watch YouTube videos on which tokens are going to the moon without any real process to due diligence or any real investment thesis. Shame on all the “influencers” out there who prey on people just to get them to watch their videos and sign up for their investment courses. Where are the regulators in protecting investors there? I digress.
The larger players are as active as ever and more of them are coming into the space in a meaningful way. Although it looks scary, when you zoom out, you realize that these networks are still young and on good growth trajectories. It is ok if they don’t exponentially go up all the time. It is ok that we get back to levels where everyone won’t feel like it’s just the wild west. It is ok to now must do the work and have a process to safely navigate digital assets and their networks. The resilient networks are set up for the long game establishing stronger foundational levels of activity and developing partnerships with big incumbents.
Despite the lack of growth in the short term we remain convicted in our investment thesis. Given the uncertainty of the macro backdrop, we expect it will take time to realize all the potential of digital asset markets as well as the value these networks will accrue. This is the time to take advantage of opportunities like dollar cost averaging and tax loss harvesting. The chess pieces are slowly getting to their positions on the board with firms establishing themselves for when regulatory clarity comes, and the macro environment improves.
Separately Managed Accounts are vastly superior investment vehicles for digital assets due to the ability to personalize the approach to investing in digital assets, take direct ownership of the underlying assets, and achieve greater tax efficiencies. In August we rebalanced both Flagship and Compass with the goal of tax-loss harvesting for those who have experienced losses since investing with Arbor Digital. Specific to Compass we removed assets that we were less convicted in and put a heavier weight towards assets we are convicted in as well.
In Flagship, we continue to be overweight ETH to BTC due to its use case evolution beyond one type of transaction, the ability to enact smart contracts across a large dApp ecosystem, and the successful merge to Proof of Stake. However, we are paying close attention to the evolution of the Lightening Network. Lightning Labs released an alpha version of its Taro software, a technology that was formally introduced at the Bitcoin 2022 conference in Miami. Taro will ultimately allow users to mint, send, and receive unique assets such as stablecoins and NFTs over Bitcoin and the Lightning Network.
Another impact on Flagship that would cause us to rethink the balance between ETH and BTC is the regulatory landscape. So much is unknown about how ETH will be considered post-merge and with the future of Proof of Work consensus by regulators.
In August we rebalanced Compass to implement what we were seeing in terms of adoption and regulatory risk. We removed assets heavily focused on privacy services in the crypto space. Given regulatory sanctions occurring across the globe and guidance coming out of different global regulatory bodies, especially in the US, we feel these are most susceptible to regulatory risk and we are uncomfortable holding them in our portfolios
We also exited networks that were not meeting network effect thresholds within our investment thesis. We allocated more heavily to networks that were evolving in the crypto winter in a healthy manner and exited networks that weren’t.
Our investment thesis that decentralized blockchain open-source software networks will move well beyond Bitcoin and Ethereum is playing out. We are more convicted than ever that the Compass portfolio is the best-in-breed portfolio to represent true broad exposure to the digital asset class. We continue to elevate ourselves and do the hard work across operations, data science, and ongoing research and analysis of the world’s first-ever 24/7 365 asset class.